How to turn a formatted report into a usable table
A step-by-step run through the add-in on a regional sales report — section headers, subtotals, spacer rows and a “prepared by” line — and out the other side as five rows you can pivot. Detection and the preview are free and unlimited.
What it does
A report you were sent is formatted for a person to read: a region name on its own row, a subtotal after each block, a blank row between them, a grand total at the bottom. Every one of those is a courtesy to a reader and an obstacle to a pivot table.
This add-in reads the layout, not just the cells. Titles, merged and multi-row headers, section groupings, subtotal rows, spacers and footers are identified as structure rather than as data with problems in it — and then removed, with the information they carried moved into columns.
Nothing is thrown away. Every removed subtotal becomes a value in a
Section column, so the grouping moves rather than disappearing. Titles and footer text
are kept in the summary.
The original sheet is never changed
The flattened table is written to a new sheet, called <source> (flat).
Undo is deleting that sheet. There is no mode, setting or edge case in which this add-in writes to
the sheet it read.
Before you start
- Excel on Windows, Mac, or the web. The pane is the same on all three.
- The add-in installed. See the support page for that.
- The report open, on the sheet you want flattened. The screenshots below use a quarterly sales report with two regions in it.
- Nothing leaves your machine. The add-in talks to one server, and only about your licence key. The privacy notice says so in full.
Step 1 — Open the pane and read the shape
Open the report, then Home › Flatten sheet. There is no button to press first: the pane reads the active sheet as it opens and tells you the shape it found before it changes anything.
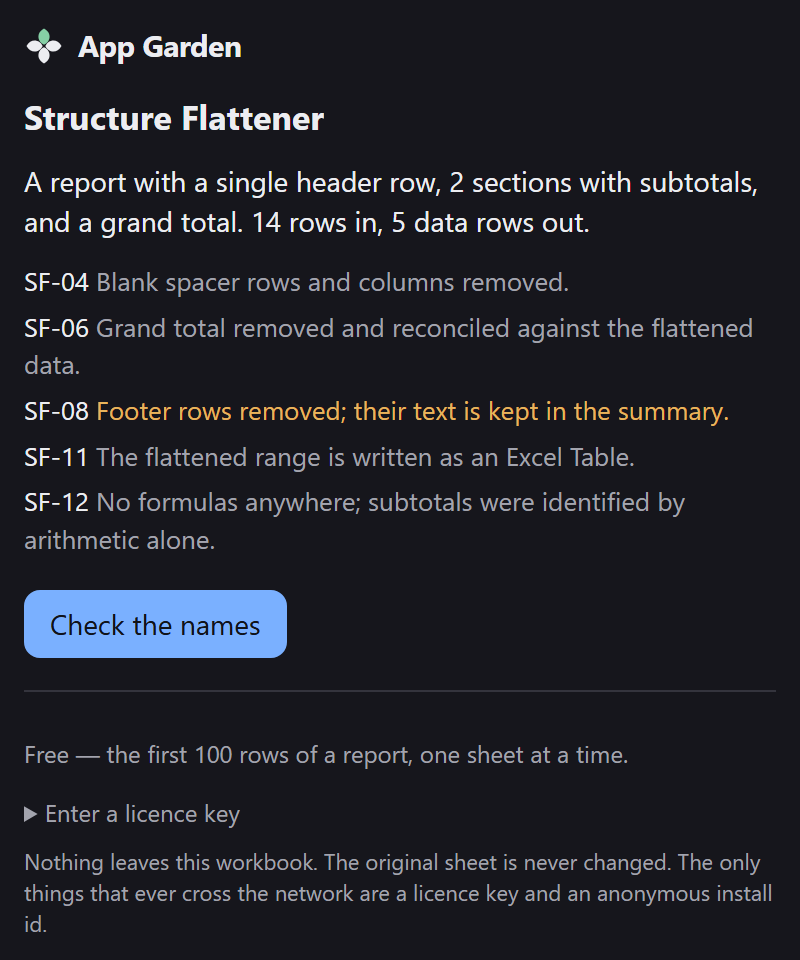
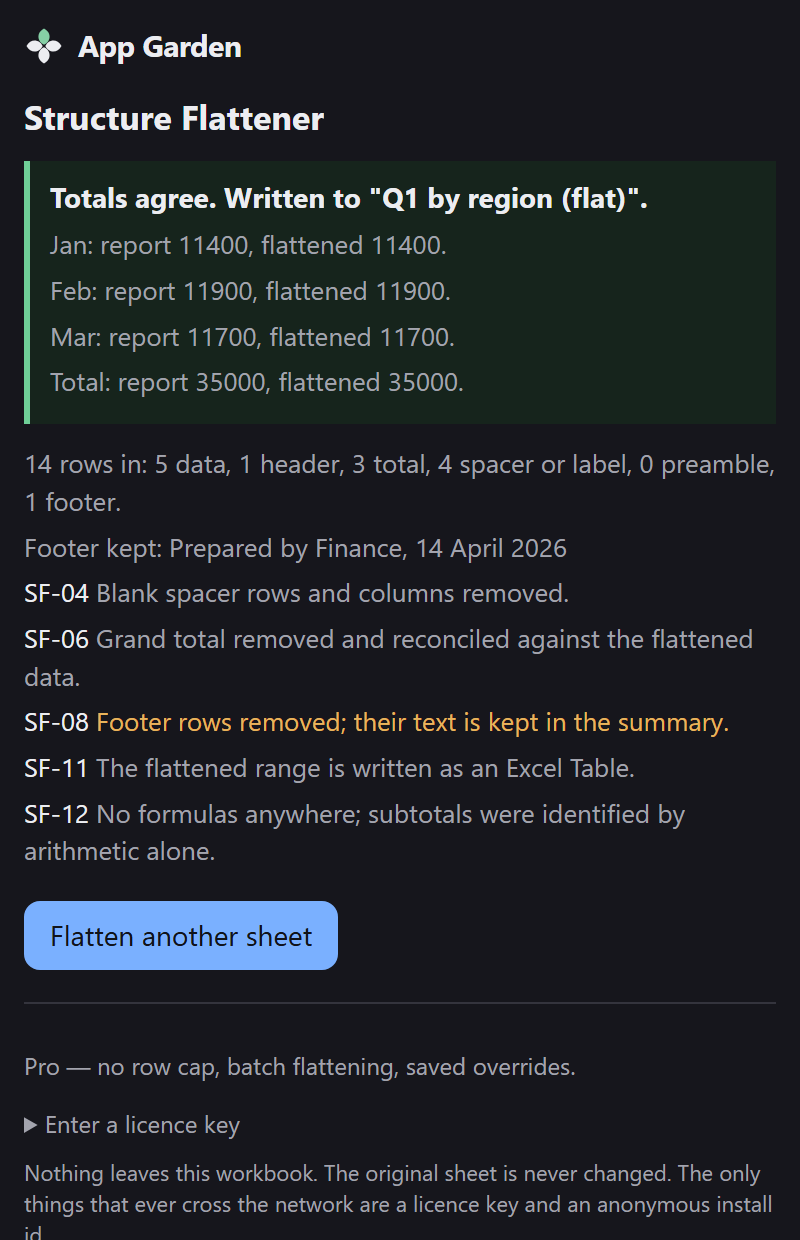
Under it, each decision it has already taken, coded so it can be quoted: spacer rows removed (SF-04), the grand total removed and reconciled (SF-06), footer rows removed with their text kept (SF-08), the output written as an Excel Table (SF-11), and — the one worth reading — SF-12, that there are no formulas anywhere on this sheet, so the subtotals were identified by arithmetic alone.
Step 2 — Check the two judgement calls
Press Check the names. The rest of the flatten is mechanical; these two are inferences, and you get a veto on both.
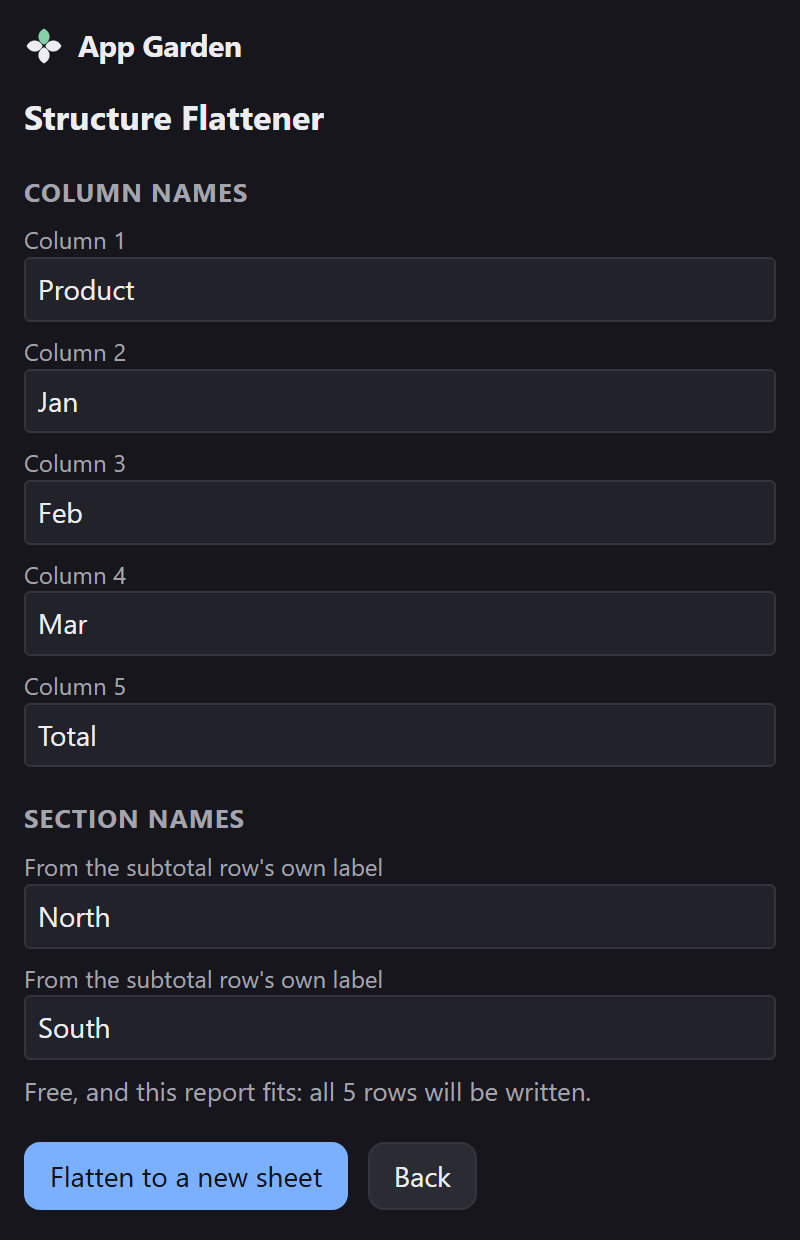
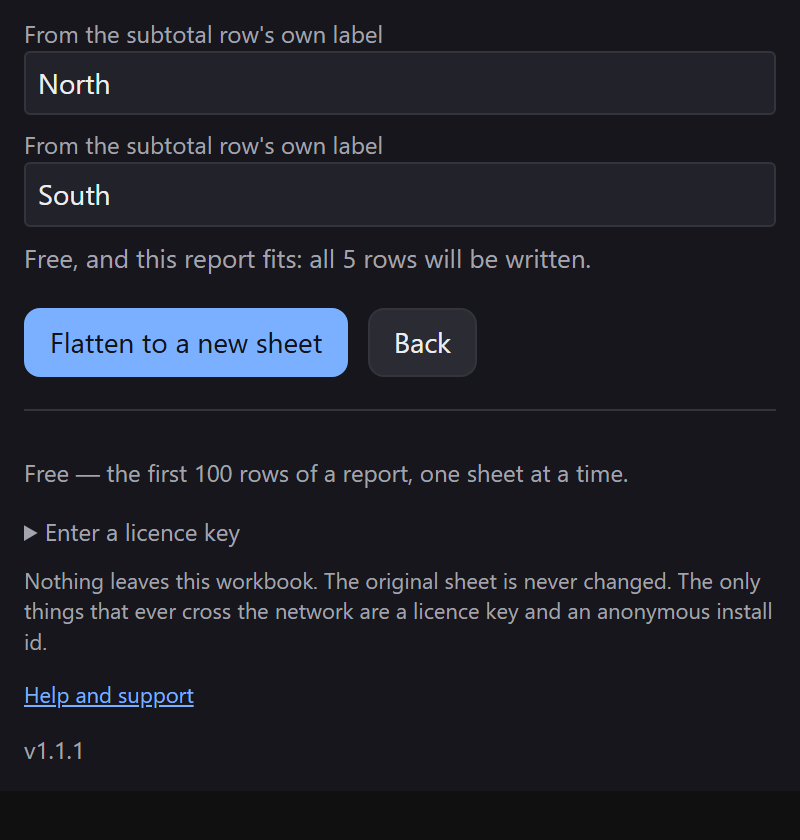
Step 3 — Check the row cap
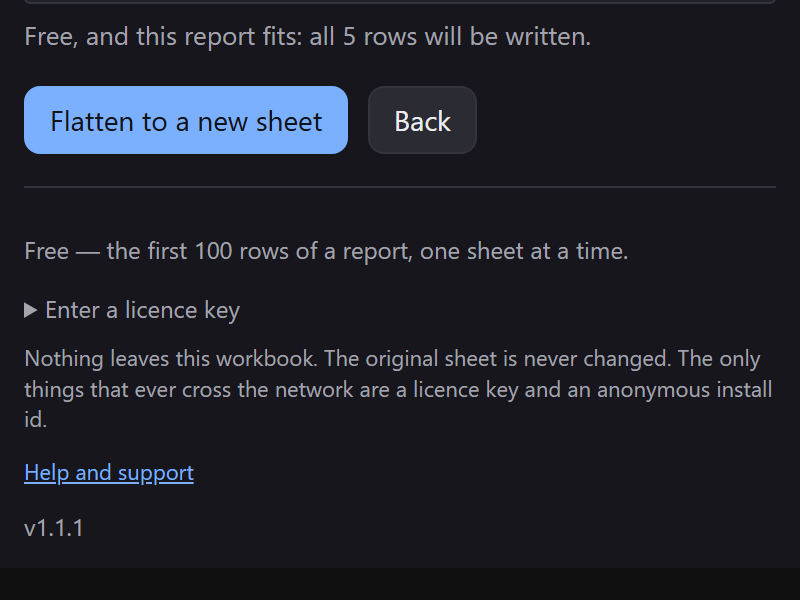
The free tier flattens the first 100 rows of a report. The preview says whether yours fits, on the screen where you decide — not after the flatten, and not as a surprise in the output.
Step 4 — Flatten
Press Flatten to a new sheet. The table is written to
Q1 by region (flat), and the pane reports what it did.
Step 5 — Read the reconciliation
The summary shows the source's grand total against the sum of the flattened rows, column by column. If those two disagree, the flatten is wrong and the pane says so at the top. That check is the reason to trust the table underneath it.
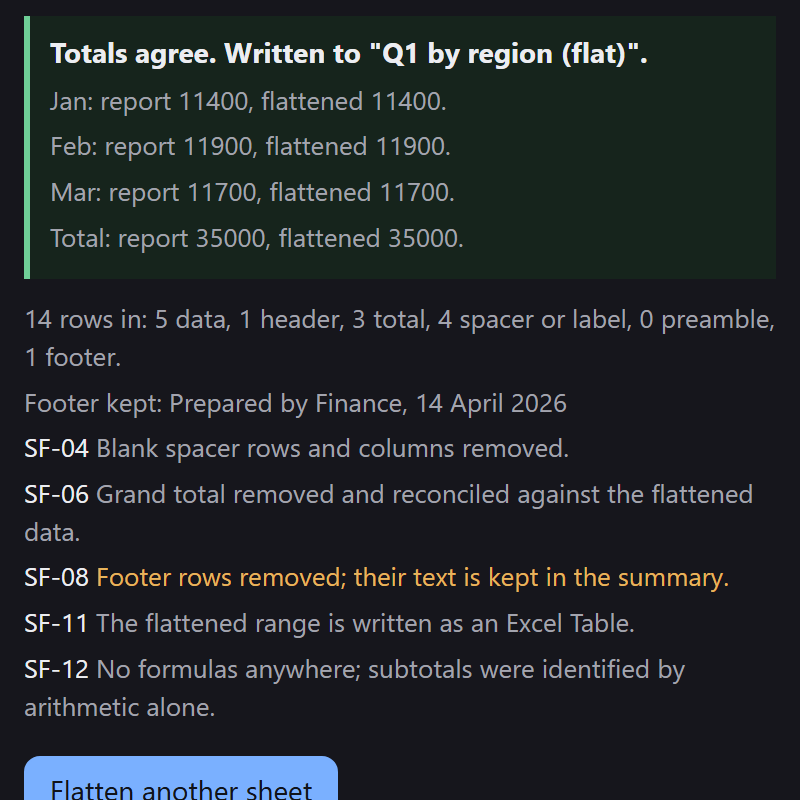
A report with no grand total gives the summary nothing to reconcile against. The pane says so plainly instead of implying a check happened.
What the paid tier adds
No row cap, multi-sheet batch flattening, and saved section-name overrides per report shape — so the same monthly report does not need its names re-checked every month. Paste your key under Enter a licence key at the foot of the pane and press Activate; it takes effect immediately.
Known limits
- One report block at a time. Two separate tables stacked on one sheet are detected and reported, but only one is flattened.
- Two levels of nesting — Section and Subsection. Deeper nesting is reported as unsupported rather than guessed at.
- No unpivoting. Cross-tab to long reshaping, and merging several sheets into one table, are not in this version.
- Subtotal detection is deliberately strict. A subtotal row with no formula, no bold and no “total” in its label is identified by arithmetic alone, and only when every numeric column matches the rows above it. Wrongly deleting a real data row is worse than leaving a subtotal in.
- Mac and iPad are untested. The manifest permits them and Microsoft lists them, but no verification run has happened on either. Please report anything odd.
If something looks wrong
Email support@appgarden.co.uk, and say which platform you are on and what the pane showed before you flattened — the shape line in step 1 is the useful part. If the shape it reported was wrong, the workbook itself is the most useful thing you can send, but only send one you are content to share, and read the privacy notice first.